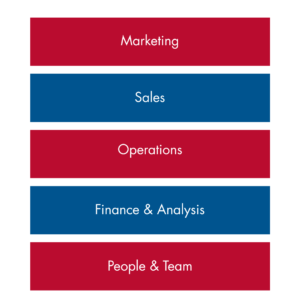
 In the ‘perfect business,’ marketing brings the leads in, sales converts the right ones and operations delivers in full, on time and in spec. Finance and analysis is where you turn all that activity into information you can act on.
Using the Five Box Model, finance and analysis means you always know what’s happened, what’s happening now and what needs to change. Not once a year when the accounts land, but month by month, when you can do something about it.
Start with the basics – invoice fast and collect cash
Before you analyse anything, you need cash coming in. The first job in this box is invoicing for what you’ve delivered as quickly as possible and collecting cash as soon as you can. Cash is the lifeblood of any business.
Some sectors invoice upfront, some invoice on delivery, some invoice after delivery. The principle is the same. Invoice accurately, invoice promptly and make collection part of the process, not an afterthought.
Look back with monthly numbers you can trust
The next step is recording performance properly. You need, a monthly profit and loss report that lets you see how the business is really doing.
And it’s not just about one total number. The more you can split performance, the more useful it becomes. For example:
• Profitability by product or service
• Profitability by client
• Profitability by area of responsibility
This is how you learn where you actually make money, not just where you’re busy.
Use the balance sheet to understand cash, not just profit
 Profit and cash aren’t the same thing. That’s why you also need to look at the balance sheet, especially the areas that drive cash movement:
• Debtors
• Stock
• Work in progress
If cash is tight, these are often the first places you’ll find the reason.
Book a complimentary call to talk through the key numbers to measure in your business
Plan forward and track performance against the plan
Finance and analysis isn’t only about reporting the past. It’s about planning the future and tracking how you’re performing against that plan.
This includes budgeting, but it also goes wider than finance. Your plan needs to connect the boxes:
• What marketing activity will generate the leads
• What sales performance will convert them
• What operations capacity will deliver the work
• What resources you’ll need to support the plan
When planning is joined up like this, you can see potential problems coming before they become expensive surprises.
What a monthly management report should look like
A strong finance and analysis box is supported by a simple monthly management report. Not a thick pack that no one reads, but a clear snapshot of what matters, in a format you can understand at a glance.
One important detail is to report over 15 months, rather than 12. That way you can see what happened a year ago and spot seasonal patterns. If December is always slower, or October is usually strong, you’ll see it immediately. And if you’re heading into a seasonal dip, you can plan for it rather than react to it.
Below is an example breakdown of graphical reporting that is clear at a glance. It follows the Five Box Model and pulls key numbers into one place.
Marketing section leads by source
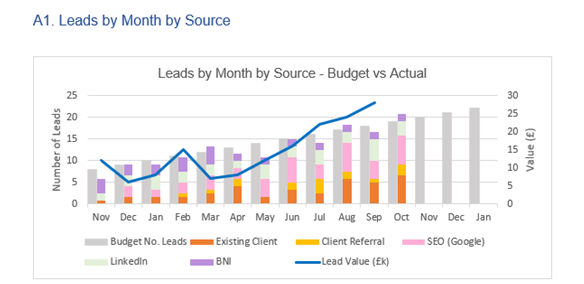 This is a stacked bar chart showing leads each month, broken down by source, for example SEO, referrals, events or existing clients.
It helps you answer two questions quickly:
• Are we generating enough leads overall?
• Where are they really coming from?
Because it shows the next three months’ targets as well as the previous months’ actuals, you can see at a glance whether your expectations feel achievable or unrealistic.
Sales section conversion rate and pipeline
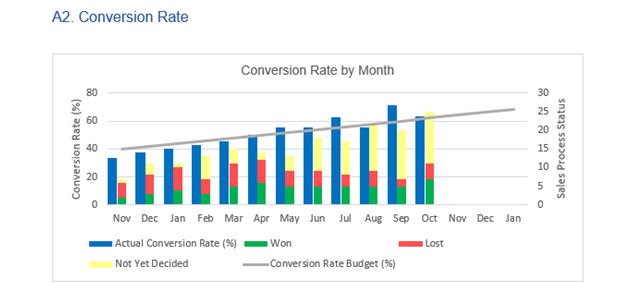 Next, the report looks at conversion rate by month. It compares actual conversion against the budgeted target, so you can see whether you’re getting better over time.
Alongside this is a simple breakdown of sales outcomes:
• Won
• Lost
• Not yet decided
This is one of the most practical sections because it drives immediate action. If you can see a pile of ‘not yet decided’ opportunities, you know exactly what to do next: i.e. follow up, ask if a decision has been made and offer any information they need to move forward.
It also highlights the value of tracking properly. Most business owners can’t answer the question ‘how many proposals are still sitting out there with no decision?’ because the information is spread across inboxes and people’s heads.
This is where the data becomes useful. When you can see exactly how many opportunities are sitting in ‘not yet decided’, you can take simple, targeted action straight away. Start by contacting each prospect and asking one direct question: ‘Have you made a decision yet?’ If they haven’t, follow up with ‘Is there anything else you need from us to help you decide?’ You’re not chasing for the sake of it, you’re removing friction and helping them move forward.
Then look at the ‘lost’ deals. A ‘no’ today isn’t always a ‘no forever’. Go back and find out why you didn’t win. Was it price, timing, scope, competitor or a lack of fit? Some will be a clean ‘no’ and you can close them down confidently. Others will be a ‘not now’, which you can diarise and revisit at the right time. This is also where patterns start to show. If you keep losing on the same reason, you’ve found something to fix in your proposition, your process or your follow-up.
Sales results by source that’s converting
Leads are one thing. Wins are another. Your report should show wins by source, tracking wins back to the month the lead first came in.
This matters because different lead sources convert at different rates. Referrals and existing clients often convert higher than colder sources. When you can see this clearly, you can invest your time and budget where it’s most profitable, not just where the volume looks good.
Operations section delivery and performance
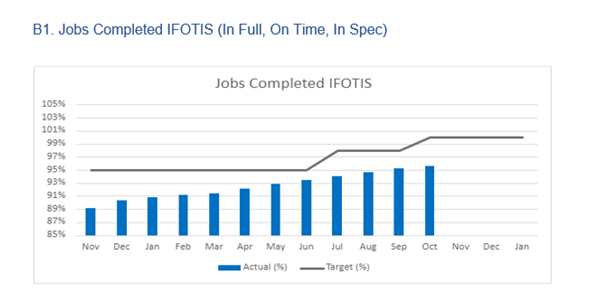 The report then moves through the operations box with key performance indicators such as:
• Jobs complete
• In full, on time, in spec
• Resource efficiency
• Customer satisfaction
This keeps operations tied to what was sold and what was promised, not just internal activity.
Book a complimentary call to talk through the key numbers to measure in your business
Finance section revenue and key cash measures
Finally, the finance section tracks revenue versus budget with a simple chart, again over 15 months so trends and seasonality are visible.
It also includes practical measures that link back to cash and performance, such as:
• Profit (for example PBIT)
• Debtor days
• Cash
• Stock value if relevant
The point isn’t to create perfection. It’s to have a consistent view of performance, so you can spot changes early and act.
The analysis part belongs here because it keeps everyone honest
In the Five Box Model, the analysis of the whole business sits inside finance and analysis. That includes marketing and sales performance, not because those teams don’t matter, but because the data needs to be objective.
For example, if you want to improve growth, you need to know:
• Leads by source by month
• How much you’re investing in each marketing source
• Conversion rate by source
• Conversion rate by salesperson
• Wins, losses and ‘not yet decided’ opportunities
If you leave this to individual teams to self-report, you often get optimism rather than accuracy. Finance and analysis is where the truth lives.
Use what you find to take action quickly
Once you can see the numbers, the next step is simple:
• What’s working – Do more of it and do it better
• What’s not working – Decide to either stop or it or improve it
• Who’s performing best – Get them to help others lift their results
The goal isn’t to produce a report. It’s to change what happens next month.
Why visibility matters – trends beat isolated numbers
A spreadsheet of figures can hide what’s really going on. But a simple visual report shows trends instantly. And trends are what matter most.
If performance is improving, you can celebrate it and double down. If it’s slipping, you can respond quickly and get the right people together to fix it. That’s the difference between steering the business and being surprised by it.
Email angelasmithson@actioncoach.com for your complimentary copy of our simple monthly management report template to track all five boxes